Hello everyone in the CodeGym community! Today let's talk about debugging — what is it and how to debug in IntelliJ IDEA.
This article is intended for people who already have a minimum knowledge of Java Core. There won't be any frameworks or complicated procedures to publish libraries. A leisurely stroll. So make yourself comfortable and let's get started!
Why you need Debug mode
Let's immediately clarify something for ourselves: there is no code without bugs... This is just how life works. So, we shouldn't fall to pieces and give up if our code doesn't work as we expected.
But what should we do? Well, we could put System.out.println statements everywhere and then comb through the console output in the hopes of finding an error. That said, you can (and people do) debug using careful logging.
But if you can run your code on a local machine, it's better to use Debug mode. I want to note right away that in this article we will consider debugging a project using IntelliJ IDEA.
What is Debug mode?
Debug mode is for debugging (checking) running code. It makes it possible for you to stop execution at designated places and look at how things are progressing. It lets you understand the state of the program at a particular place in the code.
It's just like being able to stop the clock and look at everything from the side. Cool, right?
Our objective is to quickly and easily learn how to debug applications using our beloved IntelliJ IDEA development environment.
What you need to start debugging
Here's some free advice: while reading this article, do everything that will be described here — you have everything you need to do follow along. What you need:
IntelliJ IDEA version 2019.3.1 or higher. In case someone doesn't have this, here's a link where you can download it. Download the Community Edition — that's the version that I will use.
Open IDEA:
Select the debug-presentation project and press OK. Then you will see the following window:
Leave the selected options: Import project from external sources and Maven. Click Finish.
Now that we've imported the project, we can describe the rest of the process with a living example.
Just a bit of theory... I promise :D
To start debugging even a little bit, you need to understand what a breakpoint is and be familiar with a few hot keys.
A breakpoint is a special marker that indicates where you want execution of the application to stop, possibly based on the application state.
You can set a breakpoint either by left-clicking on the left side panel, or by clicking on the code location and pressing Ctrl+F8.
Let's look at three types of breakpoints: line breakpoints, field watchpoints, and and method breakpoints.
This is how it looks:
On a line:
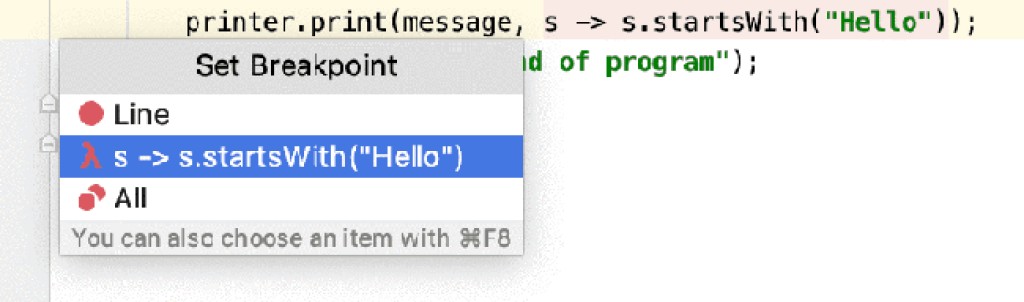
If a statement has a lambda expression, then IDEA prompts you to choose whether to put the breakpoint on the entire statement or specifically on the lambda expression:
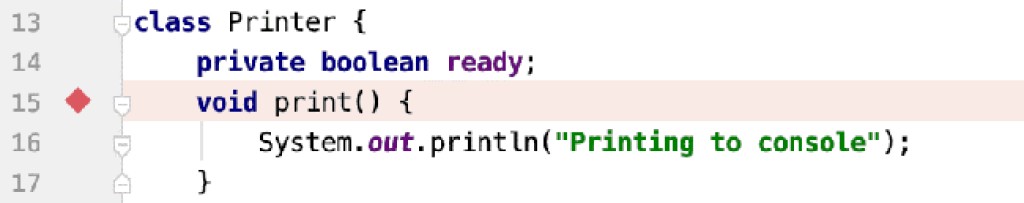
On a method:
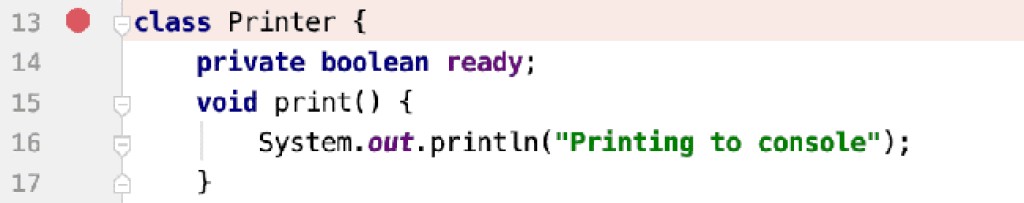
On a class:
Breakpoints can be removed by following the same steps used to add them. There are situations when you'll want to inactivate (mute) them. To do this, find the icon in the Debug section. This will mute all breakpoints. To see what breakpoints have been set, you can either go to Debug section in the lower left corner and find the
icon, or press Ctrl+Shift+F8: Moving to the list of breakpoints, we will see the following:
There are two breakpoints here:
Bee.java:24 — in the Bee class on line 24
Main.java:14 — in the Main class on line 14
Please note that these breakpoints won't be set automatically if you've cloned the project: you'll need to set them yourself!
There is also a Java Exception Breakpoints section. It is very useful. Here you can add an implicit breakpoint so that the program stops before throwing any exception or a specific exception.
We'll add an implicit breakpoint for RuntimeException. This is easy to do. Find the "+" icon in the upper left corner. Click on it and select Java Exception Breakpoints:
In the window that appears, write the name of the exception that you want to add, select from the list and click OK:
That concludes our primer on how to set things up, so now we'll move on some practice.
Let's go do this thing called debugging!
I come from a long line of family beekeepers, so the project I created to illustrate debugging describes models the process of bees collecting nectar, processing nectar into honey, and then getting honey from the beehive.
According to the documentation README file, which can be found in the project's root directory, the expected behavior of all flowers from which nectar is collected is for the amount of collected honey (which takes the form of a double) to be equal to half of the collected nectar. The project has the following classes:
Bee — an ordinary worker bee
BeeQueen — the queen bee
BeeHive — the beehive
HoneyPlant — a honey plant (nectar source) from which nectar is collected
Main — this is where we find public static void main(), the method where execution starts.
If we run the main() method, then we find that not only does our program not calculate the amount of honey, it also throws an exception...
We need to investigate and determine what the problem is.
From the trace stack in the lower right corner, we can see that in a RuntimeException was thrown at HoneyPlant.java:20:
That's just what we were talking about above. Let's watch for this RuntimeException by running the main() method in debug mode.
To do this, click on the green triangle arrow in IntelliJ IDEA next to the main() method.
As a result, we'll get the program stopped at the moment right before the exception is thrown and we'll see this icon:
To get all the available information, we need to look in the Debug section. It has a Variables pane that shows all the variables available in this part of the application:
nectar = 1.0;
nectarCapacity = -1.0.
Throwing the exception makes sense, because a honey plant can't have a negative amount of nectar. But why is this happening? After all, in lines 15-17, we check whether the nectar supply is exhausted and return zero if it is:
if(nectar ==0){return0;}
But trouble is that we're checking the wrong variable. This is an error in the code. Instead of checking the amount of nectar available in the flower (which is stored in the nectarCapacity variable), the program checks the value of the method's nectar parameter, which is the amount of nectar that we want to take from the flower.
Here it is! Our first bug!
After fixing this, we get the following code:
if(nectarCapacity ==0){return0;}
Now run the main() method in the normal way (Run 'Main.main()'). There is no exception thrown, and the program works:
The application runs to completion and gives the following answer:
"33.0 honey was produced by 7 bees from 2 honey plants"
Everything would be fine now, but this answer is incorrect... According to the documentation README file, nectar is converted to honey at a ratio of 2 to 1:
## DocumentationPresentation based on honey production.**Note**:2 units of nectar =1 unit of honey
The main method clearly has two honey plants with 30 and 40 units of nectar, respectively. So we should ultimately end up with 35 units of honey. But the program is telling us we get 33. Where did the other two units go? Let's find out!
To do this, set a breakpoint in the Main.main() method on line 28, where beeHive.populateHoney() is called and run the main() method in Debug mode:
We'll consider this point in greater detail. The program stopped executing before executing line 28.
In the lower part, we see the Debug section, which shows all the available information about the running application.
As already mentioned, the Variables pane contains all the variables and objects available from this part of the application.
The Frames pane shows the steps that the application is going through — you can look at previous (frames) steps and see all the local data.
To continue running the program, you can press F9 or the green icon, as shown below:
To stop the program, click on the red square:
To restart the application in debug mode, click on the arrow: Further, you can proceed through the application step by step using two keys:
F8 — Step through the code without stepping into methods;
F7 — Step through code and step into methods.
In our case, we need to press F7, to step into the beeHive.populateHoney() method. Stepping into it, we get:
Now we'll use F8 to step through this method and describe what happens in it:
Line 25 — The Stream API is used to collect nectar from all the bees
Line 26 — The newly created honey is added to the existing honey;
Line 27 — 2 units of honey are allocated for the queen
Line 28 — These two units are removed from the total amount of honey
Line 29 — The queen eats this honey.
So that's where the two missing units went! Hurray! After talking with a business analyst, we conclude that the documentation README file contains an error and needs to be updated.
Let's update the README file:
## DocumentationPresentation based on honey production.**Note**:*2 units of nectar =1 unit of honey
*The queen bee eats 2 units of honey every time when beehive is replenished withhoney.
We're done. We've fixed all the bugs we found. We can calmly carry on with a smug look, sip some coffee, and read articles on Stack Overflow CodeGym :)
Let's summarize
In this article, we learned:
everybody's work has errors and debugging is a great way to fix them
what a breakpoint is and what types of breakpoints there are
I came across an error "java: java.lang.NoSuchFieldError: Class com.sun.tools.javac.tree.JCTree$JCImport does not have member field 'com.sun.tools.javac.tree.JCTree qualid'', and it came out to be my jdk-21 version was not compatible with the plugin Lombok, which appeared at Bee.java: 9. At last I changed the jdk version in project structure to SDK 17 and managed to get it run normally.
The early comments about setting breakpoints at Bee.java:24 and Main.java:14 were confusing. Don't set those break points. Many of the screenshots are too small and blurry to read. Someone pushed their changes and made it so README.md doesn't match the initial description in the article.
#Abhyu08 : Really a good Example to Understand Debugging Process.
Thanks a lot for your efforts !!
:-) Best regards from India :-)
Github Link : Cloned link with modifications.
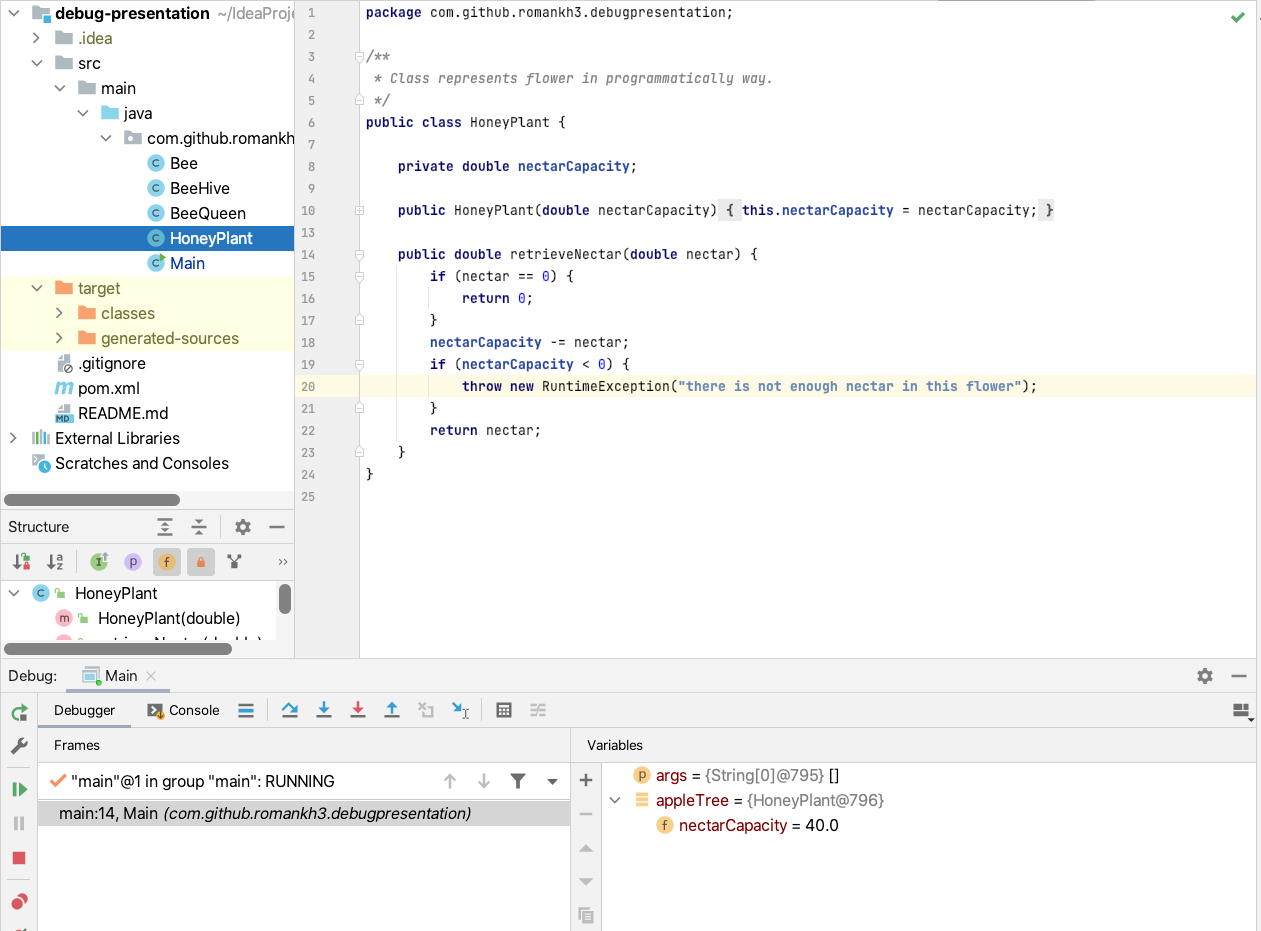
I dont know why I dont get the program stopped at the moment right before the exception is thrown and we'll see the icon as specified above.
Below is my setting of Java Eexception Breakpoints:
Furthermore, my nectarCapactity is =40 in the Pane Variables.
I don't know what has gone wrong. Your advice is much appreciated. Thanks in advance.
Maybe this comment can help you (or another person)
1. Delete the breakpoint at line 14 in main.java
2. Run the main() method in debug mode
3. File HoneyPlant.java will be opened by IntelliJ and you will find nectar = 1, nectarCapacity = -1
Hi there,
I don't know if it's because I did something wrong but after clonning the project I get two errors in the Bee class.
The first one is in the 4th line "import lombok.Data;" --> Cannot resolve symbol lombok
The second one is inthe line 9th line "@Data" --> Cannot resolve sysbol Data
Any idea why?

 Select the debug-presentation project and press OK. Then you will see the following window:
 Leave the selected options: Import project from external sources and Maven. Click Finish.
Now that we've imported the project, we can describe the rest of the process with a living example.
Leave the selected options: Import project from external sources and Maven. Click Finish.
Now that we've imported the project, we can describe the rest of the process with a living example.


 icon in the Debug section. This will mute all breakpoints. To see what breakpoints have been set, you can either go to Debug section in the lower left corner and find the
 icon, or press Ctrl+Shift+F8:
 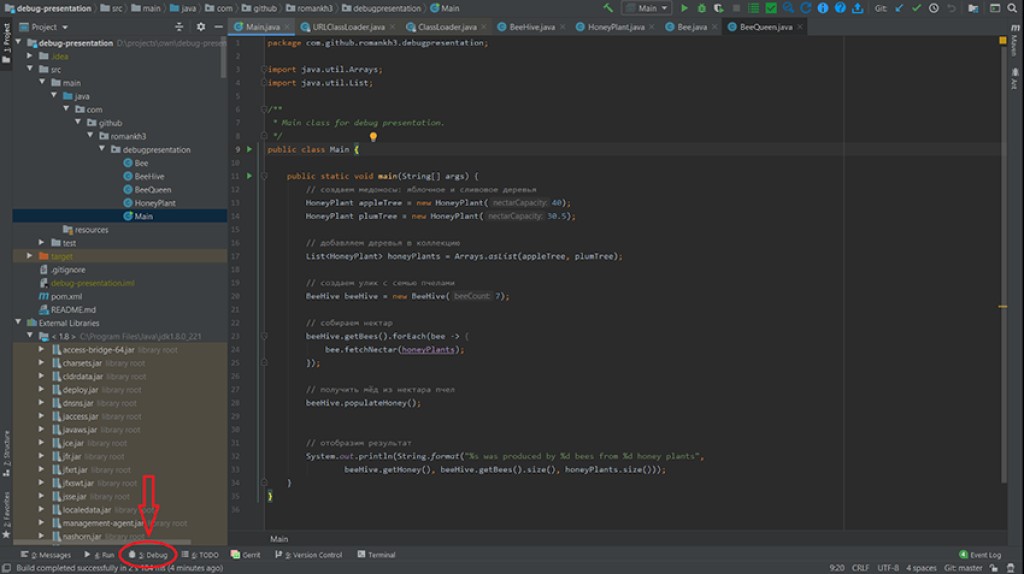 Moving to the list of breakpoints, we will see the following:
 There are two breakpoints here:
 In the window that appears, write the name of the exception that you want to add, select from the list and click OK:
 That concludes our primer on how to set things up, so now we'll move on some practice.
 We need to investigate and determine what the problem is.
From the trace stack in the lower right corner, we can see that in a RuntimeException was thrown at
We need to investigate and determine what the problem is.
From the trace stack in the lower right corner, we can see that in a RuntimeException was thrown at  That's just what we were talking about above. Let's watch for this RuntimeException by running the
  As a result, we'll get the program stopped at the moment right before the exception is thrown and we'll see this icon:

 To get all the available information, we need to look in the Debug section. It has a Variables pane that shows all the variables available in this part of the application:
 The application runs to completion and gives the following answer:
 We'll consider this point in greater detail. The program stopped executing before executing line 28.
In the lower part, we see the Debug section, which shows all the available information about the running application.
As already mentioned, the Variables pane contains all the variables and objects available from this part of the application.
The Frames pane shows the steps that the application is going through — you can look at previous (frames) steps and see all the local data.
To continue running the program, you can press F9 or the green icon, as shown below:
We'll consider this point in greater detail. The program stopped executing before executing line 28.
In the lower part, we see the Debug section, which shows all the available information about the running application.
As already mentioned, the Variables pane contains all the variables and objects available from this part of the application.
The Frames pane shows the steps that the application is going through — you can look at previous (frames) steps and see all the local data.
To continue running the program, you can press F9 or the green icon, as shown below:
 To stop the program, click on the red square:
 To restart the application in debug mode, click on the arrow:
  Further, you can proceed through the application step by step using two keys:

 Now we'll use F8 to step through this method and describe what happens in it:
 Below is my setting of Java Eexception Breakpoints:
 Furthermore, my nectarCapactity is =40 in the Pane Variables.
 I don't know what has gone wrong. Your advice is much appreciated. Thanks in advance.