1. Bug
Programmers have their own slang, though many consider it to be technical jargon. In any case, you cannot avoid getting to know it. You need to dive into the detail. So let's dive in.
One of the first words you will get to know is "bug", i.e. an insect. In the context of software development, this word means an error in a program, an instance of the program doing something wrong or not quite right. Or simply working strangely.
But if a programmer thinks the program, despite its odd behavior, is doing exactly what it is supposed to, then he or she usually declares something like "it's not a bug, it's a feature". Which has spawned a bunch of internet memes.

In general, there can be any number of reasons for a software defect: anything from errors in the program's logic, typos, and incorrect program architecture, right up to problems in the compiler. In any case, programmers need to fix both real bugs and any other "shortcomings" in their programs.
The history of the word "bug"
The most common version of the origin of the word "bug" is something of a legend.
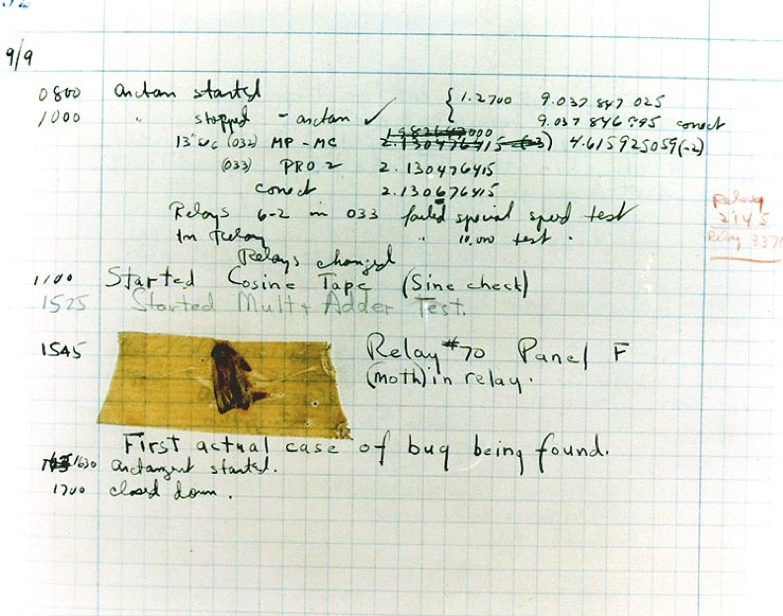
In September 1945, scientists at Harvard University were testing one of the first computers, the Mark II. The computer wasn't working properly, and in the process of checking all the boards, they found a moth stuck between the contacts of an electromechanical relay.

The extracted insect was taped into a technical log, accompanied by this inscription: "First actual case of bug being found."
This funny story is believed to be the beginning of the use of the word "bug" to mean an error, and the word "debug" has become synonymous with eliminating bugs.
2. Debugging the program
To fix bugs in their programs, programmers use special programs called debuggers. Some of these programs even know how to debug machine code.
Java programmers use IDEs for debugging their programs. Such as IntelliJ IDEA, Eclipse, and NetBeans. IntelliJ IDEA is by far the most powerful IDE, so we'll walk through the debugging process using it as an example.
IntelliJ IDEA can run your program in two modes:
| Execution modes | Toolbar icon | Hotkeys |
|---|---|---|
| Normal execution |

|
Shift+F10 |
| Start in debug mode |

|
Shift+F9 |
You are already familiar with normal execution: the program starts, runs, and exits. But debug mode has a lot of surprises in store for you.
Debug mode
Debug mode lets you to walk step by step through your entire program. Or more accurately, it lets you move line by line. What's more, you can observe the values of the variables at each step of the program (after each line of code is executed). And you can even change their values!
To gain even a minimal grasp of debugging a program, you need to learn three things:
- Breakpoints
- Step-by-step execution
- Inspecting the value of variables
3. Breakpoints
The IDE lets you place special markers called breakpoints in your code. Every time a program running in debug mode reaches a line marked with a breakpoint, execution will pause.
To put a breakpoint on a specific line, you just need to click to the left of the line in IDEA. Example:

The line will be marked with a breakpoint, and IntelliJ IDEA will highlight it in red:

A second mouse click on the pane to the left of the code will remove the breakpoint.
A breakpoint can also be placed on the current line simply by using the hotkey combination Ctrl+F8. Pressing Ctrl+F8 again on a line that already has a breakpoint will delete it.
4. Start the program in debug mode
If you have at least one breakpoint in your program, you can run the program in debug mode by pressing Shift+F9 or clicking the "bug icon".
After starting in debug mode, the program runs as usual. But as soon as it reaches a line of code marked with a breakpoint, it will pause. Example:

In the upper half of the screenshot, you see program code with two breakpoints. The program's execution stopped on line 5, which is marked with a blue line. Line 5 has not been executed yet: nothing has been output to the console yet.
In the lower half of the screen, you see the debug panes: the Debugger pane, the Console pane, and a set of buttons for debug mode.
You can unpause your program (i.e. continue execution) by pressing the Resume Program button on the bottom left pane (or press F9).

If you press this button (or F9), the program will continue to run until it encounters the next breakpoint or ends. Here's what we see after clicking the button:

The program stopped at the second breakpoint, and the words Hello and and can be seen in the console. This is a sign that we have executed only two of the three lines that display output on the screen.
5. Step-by-step execution
If your program is running in debug mode, you can also step through it: one step isone line. There are two hotkeys for step-by-step execution: F7 and F8: each causes the current line of code to be executed. But first, you still have to stop your program with a breakpoint.
If you want to execute your program line by line, you need to put breakpoint at the beginning of the main() method and run it in debug mode.
When the program stops, you can start executing it line by line. One press of the F8 key executes one line.
This is what our program looks like after it stops and we press the F8 key once:

The first line of the main method has already been executed, and the current line is the second line. You can also see at the bottom of the screenshot that the word Hello is already displayed on the screen.
6. Step-by-step execution with stepping into methods
If you have written your own methods in the program and you want execution to go inside your methods in debug mode, i.e. you want to "step into the method", then you need to press F7 rather than F8.
Let's say you step through the program and are now stopped at line 4. If you press F8, IDEA will simply execute the fourth line and move on to the fifth.

But if you press F7, IDEA will step into the main2() method:

It's very simple. If you don't really care what happens inside a method or how, then you press F8. If it is important, then press F7 and step through all its code.
GO TO FULL VERSION